
If the Mississippi River Won’t Drain, Pull the Drain Plug
Since 2016, Bigger Pie (BPF) has warned repeatedly that water reaches the Lower Mississippi River (MSR) faster than it can get out to the Gulf of Mexico (GOM). The yearly average water level has been rising from Vicksburg and going south to Old River Control Structure (ORCS), below Natchez. Government data show this occurring in the low and high rainy seasons. Since about 1950, the low water averages are 11 ft. higher at Natchez and 4 ft. higher at Vicksburg. Flood water averages are higher for longer durations.
The 30-year daily average gauge reading at Natchez for 1990 – 2019 is 9 feet higher than the average from 1950-1969 (See Table 1). Notice the upward trend in the gauge reading even as rainfall across the MSR Basin in the past 50 years has increased about 14% or about 4.5 inches per year, while low water at Natchez has increased 11 ft. By averaging 20 and 30 years of data, the above or below average rainfall for a year or two becomes irrelevant. Heavier rainfall is a small part of more frequent and longer MSR floods. The bathtub (see “The River Stands Still”) that is the Lower MSR can’t drain, increasing the number and severity of floods.
TABLE 1

Based on extensive research, BPF and Dr. Y. Jun Xu– hydrologist of Louisiana State University, have concluded that sedimentation in the MSR bed is reducing the flow rate year round but especially during flood conditions. The channel just below ORCS has developed a massive 20-25 mile long and 50 ft. or higher sediment blockage, greatly reducing flow. The river is backing up as noted above. Manmade changes in the river, coupled with manmade changes across the entire MSR Basin result in faster water runoff. An irresistible force meets an immovable object just below the ORCS on the west side of MSR across from the Mississippi and Louisiana state line.
BPF recently found two Corps. of Engineers reports detailing their 1973 MSR flood conclusions. Why were 1973 flood waters so much higher than the 1950 flood at similar water flow rates? The following is a quote from page 3 of their December 1982 report, “Analysis of Major Parameters Affecting the Behavior of the Mississippi River.”
“At the peak stage of the 1973 flood with the river approximately 10 ft. above
bankfull stage, computations indicated that the capacity of the river was about 15
percent (350,000 cfs) less than the capacity under 1950 channel conditions.
The loss of capacity of the river amounted to about a 4.5-ft upward shift of
the 1973 stage-discharge relationship compared to the 1950 relationship.”
In simple terms, the water could not get out of the Lower MSR in 1973 as readily as it could in 1950. Water was partially blocked and backing up in 1973 resulting in higher flood waters. What will they say about the 2019 flood which has left the 1973 flood in its wake? Why is the MSR capacity for water flow continuing to diminish so rapidly as evidenced by the floods of 2018-2019 vs. 1972-1973?
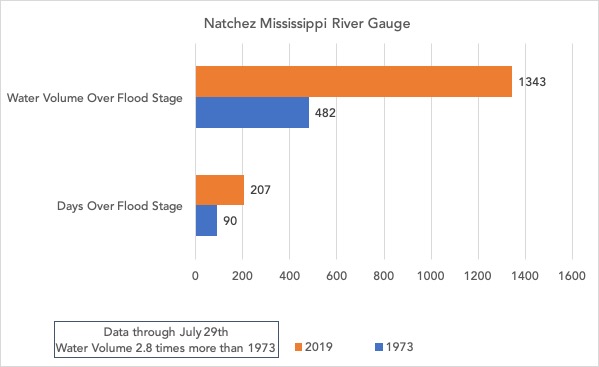
BPF has compared the 1972-1973 and 2018-2019 floods. Total rainfall across the entire MSR basin was about equal for July 1972 – April 1973 and July 2018 – April 2019. Yet, the river at Natchez was above 48 ft. flood stage 36 days through April 1973 vs 87 days through April 2019. By April 8, 2019, more water over 48 ft. flood stage passed Natchez than by end of the 1972-1973 flood, June 2. By May 3rd, the 2019 flood had surpassed the 1973 flood by several key measures, see Chart 1. The entire 1973 flood was 90 days above flood stage at Natchez and as of July 29th, the 2019 flood has been 207 days above flood stage and still at 51.8 ft.
Isn’t it time to either remove the plugs in the Lower MSR or to open the other drain —Old River Control Structure? Physical evidence shows the current Corps. strategy for MSR is yielding increased risk of “The Big One.” There is a similarity between the Corps. electing to manage ever increasing water levels and Boeing deciding to build a less costly, unstable plane but manage instability. Why not build a more inherently stable plane and why not focus managing lower water levels by getting water out of MSR reducing odds of “The Big One?” Eventually, ever strategy reaches limits. The best strategy grows and protects the farm but does not put it out of business when reaching strategy limits.
CHART 1
-
-
- Water volume over flood stage is a relative measure of the flood water volume. It is calculated by subtracting 48 ft. from all daily gauge readings of 48 ft. or higher and summing the difference. The number relates to the millions of acre feet of flood water passing Natchez. For 2019, the waters over flood stage at Natchez have at least 2.8 times the volume of water over flood stage for the entire 1972-73 flood. The 2019 flood is not yet over.
-
To sign up for MS River Updates from BPF, subscribe here.
This is frustrating. We, the public, spend a lot of energy criticizing and trying to direct the Corps to solve the problem. But has the Corps positively responded? Have they offered an opinion what needs to be done (they are the experts, not we, the public). What has the Corps done? Is the problem all politics or is it more complex than we realize? I.e. would opening the ORCS more just create a plug in the Atchafalaya same as has occurred in the Mississippi? Lots of questions. No answers.
This is something I have thought about a lot since I retired. The Mississippi river delta, as best I can tell is some of the richest farmland in the world. So why are we channeling it as far out in the Gulf of Mexico as we can, where it becomes a nuisance instead of an asset. Why could that mud not be pumped out of the river and made into farmland before it reaches saltwater?