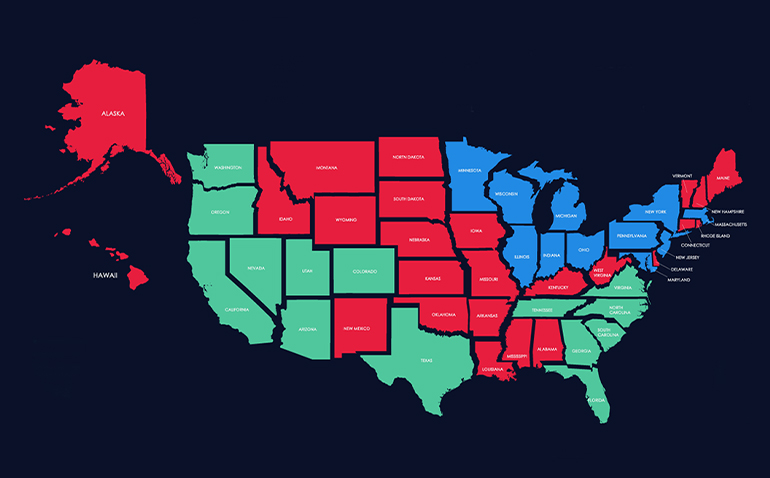
U.S. Regions Measured by Population and GDP
When measured by Gross Domestic Product (GDP or economic activity), growth of GDP or population, the U.S. easily separates into five regional groups. These are the Pacific/Southwest, Texas, Atlantic/Southeast, Great Lakes/Northeast and the remaining 25 states (mainly Middle America). These regions are depicted on the accompanying map. The red region is 25 states and the other 4 regionals combined contain 25 states plus D.C.
The 25 states displayed in red on the map comprise 18% of the 2019 U.S. population (down from 21% in 1970) and 16% of 2019 gross domestic product (down from 21% in 1970). For these states, both population and GDP growth was subpar between 1970 – 2019 and appears to have gotten worse from 2010 – 2019. Most of these states are more rural than the other 25 states and D.C. and show no signs of turning themselves around.
The other 25 states displayed in green & blue form four economically strong and growing regions of the Pacific/Southwest, Texas, Atlantic/Southeast and Great Lakes/Northeast. The Pacific/Southwest, Texas and Atlantic/Southeast regions displayed in green also have had strong population growth and varying but above average economic growth for 50+ years. The Great Lakes/Northeast region had surprisingly strong economic growth but very low population growth between 1970 – 2019. This suggests increasing productivity as this region renews the economic base. The 50-year GDP growth in Atlantic/Southeast has lagged population growth due in part to the makeup of the economic base in the region but also due to the large proportion of retirees moving into that region.
We will be posting additional analysis of the regions.
Scroll over the map to see U.S. Regions Measured by Population and GDP for 2019
Sign up for BPF’s latest news here.